Part 3. Properties, Additives, & Preparation
3.2 Heat Resistance
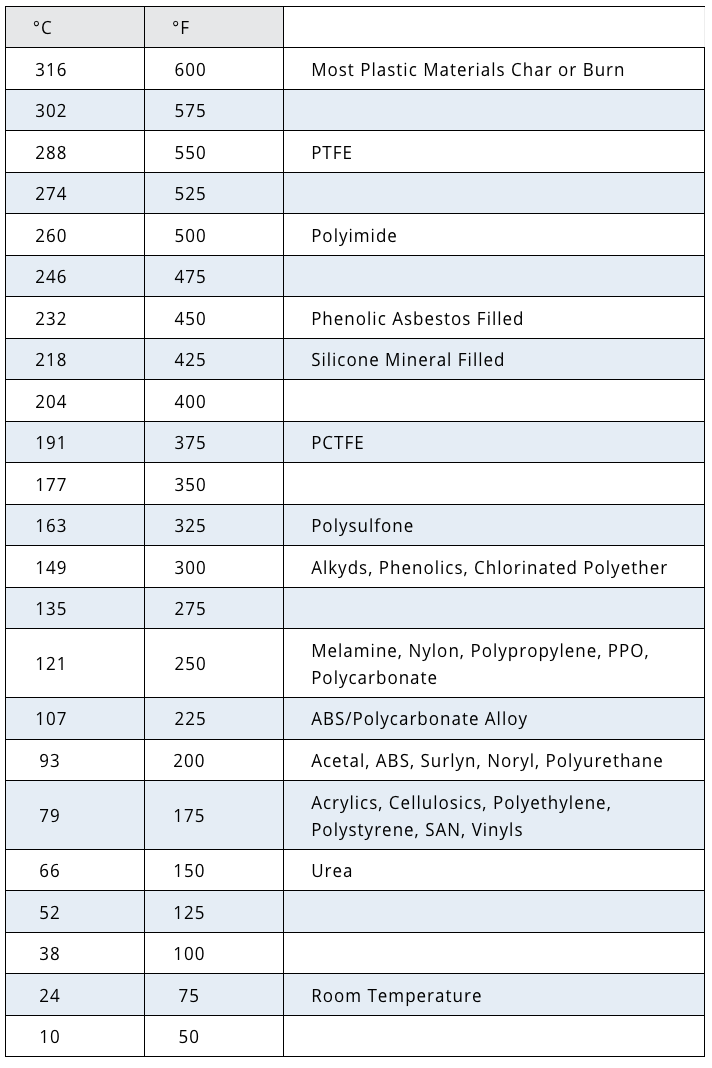
The safe continuous heat resistance temperature of plastics is an important factor in many applications. Although a polymer like PTFE has a high heat resistance temperature of 550°F it lacks most of its mechanical properties at that point. The following figure shows the continuous heat resistance temperatures of plastics but it does not necessarily mean the plastic will maintain optimal mechanical properties at that point.
3.3 Hardness
The hardness of a plastic is usually recorded as a measure of the resistance of the material to indentation by a steel ball or point under load. The hardness is expressed as a number derived from the net increase in depth of the indentation during the hardness test. Since all plastics have unique creep and recovery characteristics, the observed hardness is actually a time dependent value which will change with the rate of loading.

3.4 Burn Characteristics
Sometimes a plastic material is identified by its burn characteristics. The table below illustrates the various characteristics of plastics when ignited.
Note: Any burn test s
Figure 3e: Burn Characteristics of Plastics

3.5 Feed Zone Temperature Study
To determine the optimal feed zone temperature for your process, you can perform a feed zone temperature study. The purpose of this study is to determine the optimum feed zone temperature by graphing feed zone temperature versus screw recovery time.
Starting with a low feed zone temperature, incrementally increase the temperature and document the screw recovery time at different increments. When graphed, the screw recovery time will drop and then rise as the temperature is increased.
The optimal feed zone temperature is the temperature at which the screw recovery time is the lowest. This is the temperature where the polymer sticks best to the barrel, causing it to convey most efficiently.
Once the optimal feed zone temperature is determined, you should adjust the rotational speed of the screw so that screw recovery consumes 80% of the overall cooling time.
Note that the back pressure used during screw recovery should be high enough to provide a consistent recovery time and consistent mixing. Your recovery times should not vary more than 5% from shot to shot, and 10% from material lot to material lot.
4 Establishing a Scientific Molding Process
A scientific molding process is an efficient and repeatable molding process which is stable and reliable with a large processing window.
Although there are many facets to a scientific molding process, the general attributes are as follows:
• The process uses one injection speed to fill, whenever possible
• The mold fills 95% to 98% full during first stage
• All cavities are short shot during first stage
• 1st stage fill is velocity-controlled and not pressure limited
• The process uses between 20% to 80% of the machine’s available
shot size
• The final cushion is approximately 10% of the overall shot size
4.1 1st Stage Filling
Since the polymer viscosity decreases as the rate of injection is increased, a higher injection speed will allow the polymer to flow into the mold more easily. At higher injection rates, shear thinning causes the polymer viscosity to be more consistent. This will lead to a more consistent and reliable process.
Using one speed will help simplify the process, and improve con-sistency. If defects occur with a single injection speed, then multiple speeds can be used. This is referred to as ‘injection profiling’. The best use of injection profiling is to solve specific defects.
When filling, it is critical to ensure you are not using a ‘pressure-limited’ process. If the maximum injection pressure setting is inadequate, the screw will slow down during injection to create what is known as a ‘pressure-limited process’. When injection becomes pressure-limited, the machine can no longer maintain the desired injection rate, resulting in an inconsistent fill rate and injection time.
4.2 1st Stage to 2nd Stage Transfer
You should transfer from 1st stage fill to 2nd stage pack before the mold is completely filled to ensure optimal efficiency and con-sistency. Such a process will be able to better compensate for variations in material viscosity. With a poorly established transfer, an increase in viscosity is likely to cause a short shot, while a decrease in viscosity results in flash. A process with a fluctuating transfer is unlikely to be consistent over time, resulting in routine flash, short shots, and sinks.
4.3 2nd Stage Pack
To determine the appropriate 2nd stage time for your process, you should perform a gate seal study. The purpose of the gate seal study is to determine an adequate 2nd stage packing time by graphing part weight versus 2nd stage time.
When graphed, the part weight will increase until the gate freezes. The optimal 2nd stage time is the time at which the part weight does not increase with an increase in 2nd stage time.
4.4 Screw Delay or Decompression before Recovery
To prevent screw damage during recovery, either screw delay or screw decompression can be used. The screw delay option allows you to add a delay after 2nd stage packing to relieve the pressure on the screw before recovery takes place. Although each process is different, the screw delay time should be enough to allow the injec-tion pressure graph to drop to zero before recovery starts.
In some high-speed applications, screw decompression or suck-back can also be used to relieve the pressure at the front of the screw. The screw decompression option works by backing the screw up before starting screw recovery.
4.5 Screw Recovery
To determine the optimal feed zone temperature for your process, you should perform a feed zone temperature study. The purpose of the feed zone temperature study is to determine an adequate feed zone temperature by graphing screw recovery time versus feed zone temperature. When graphed, the screw recovery time will drop and then rise as the temperature is increased. The optimal feed zone temperature is the temperature at which the screw recovery time is the lowest.
Once the optimal feed zone temperature is determined, you should adjust the rotational speed of the screw so that screw recovery consumes 80 percent of the overall cooling time. For example, if your process has a ten second cooling time, your shot should be recovered approximately two seconds before the cooling time is finished.
4.6 Screw Decompression after Recovery
For most screws, the optimal amount of ‘screw suck back’ should be equal to the amount of ‘check ring travel’. Since the size and configuration of check ring assemblies vary, you may have to ask the manufacturer or pull the screw and actually measure the check ring travel.
4.7 Cooling
To establishing cooling, begin with a longer cooling time than should be necessary. You can first determine the lowest mold temperature which provides an acceptable part. Once this mold temperature is established, you can lower the cooling time to determine the lowest cooling time which provides an acceptable part.